Trading Algos
What are the trading algos?
Through my job as a broker, since 1998, I have spent 100's of hours researching the markets in attempt to gain an "edge" and be able to assist my clients better. The results are a family of studies and trading conditions I programed and tested, that i feel comfortable using to analyze the markets. I use my ALGO's in different ways in some of the trading programs and I use them also when looking at the markets in different time frames as a broker.
Obviously there is more to trading than just studies. There is trade management, entry and exit techniques, fear and greed and much more....but I hope that you can evaluate the studies/ ALGOs and decide if it can be of help in your trading.
I currently have 3 main ALGOS to offer for clients to use either with: TradingView , Sierra charts or CQG charts ( both CQG IC and CQG Q trader) - All charting packages offers free trial.
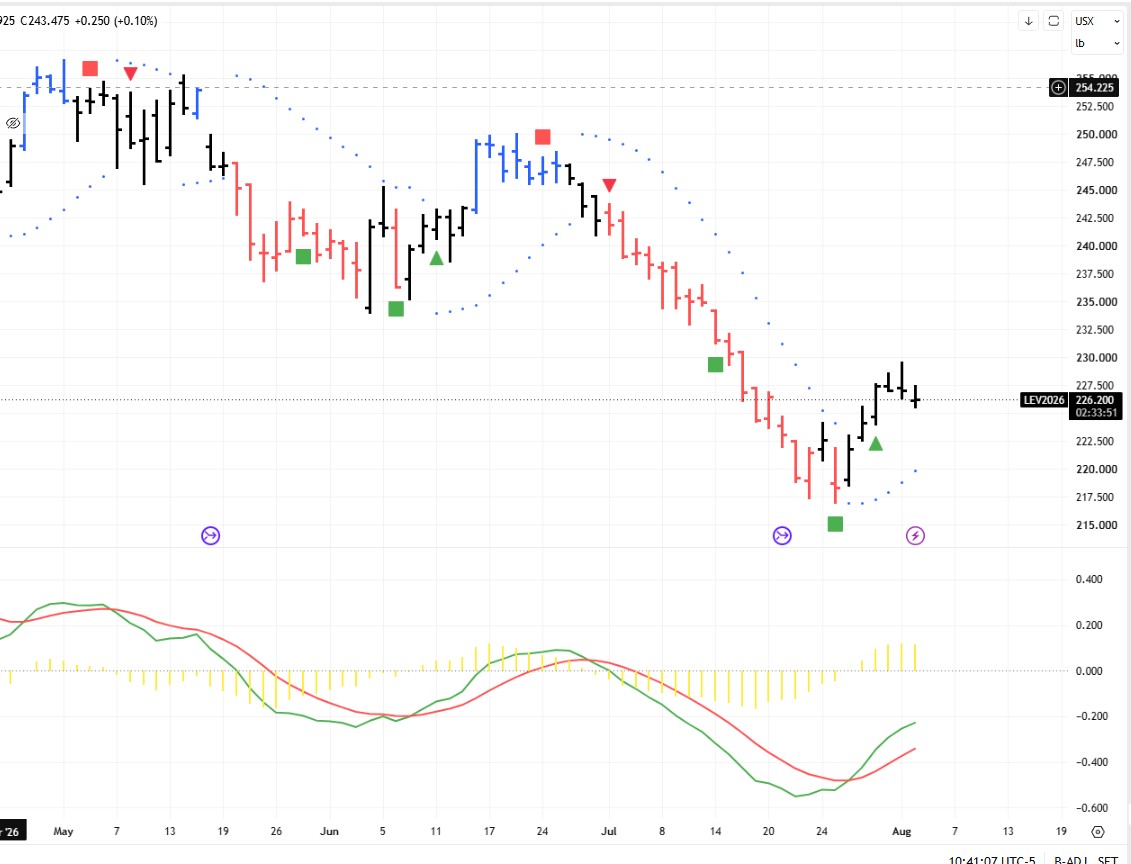
Diamonds: DIAMONDS are an algorithm I came up with as I was designing different trading systems. It is a proprietary algorithm that tries to measure exhaustion in selling or buying and possible chance of short term reversal. The ALGO calculates recent highs/lows, consecutive highs/lows, RSI, volatility and then the formula outputs; a number that either meet certain criteria or not. RED diamonds suggest possible short term top. Green or blue diamonds suggest possible short term bottoms. Like any other indicator, trading strategy, we simply don’t know what the future will bring, in our case the next few minutes, sometimes seconds…hence the use of the term “suggested”.
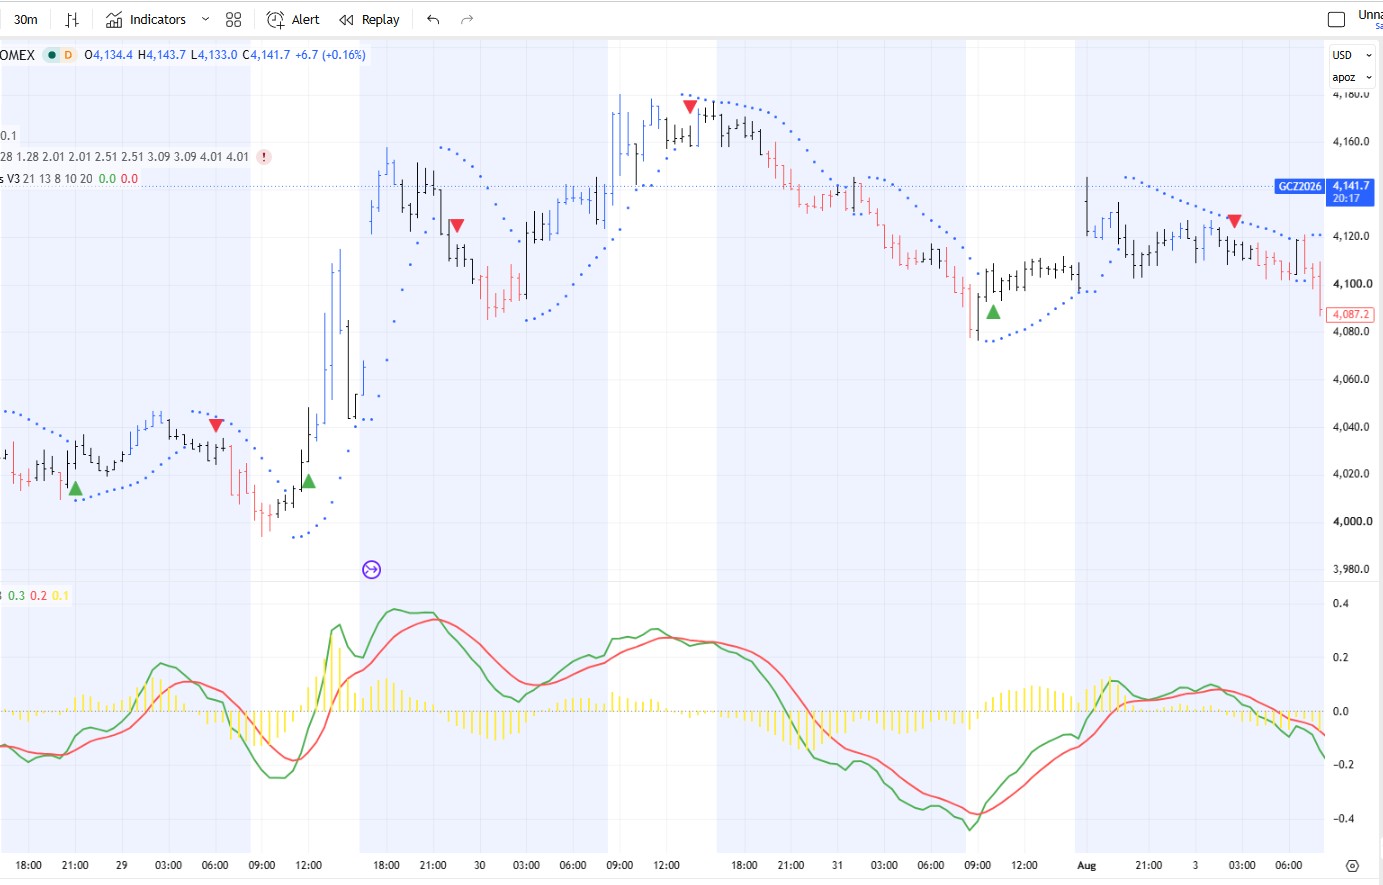
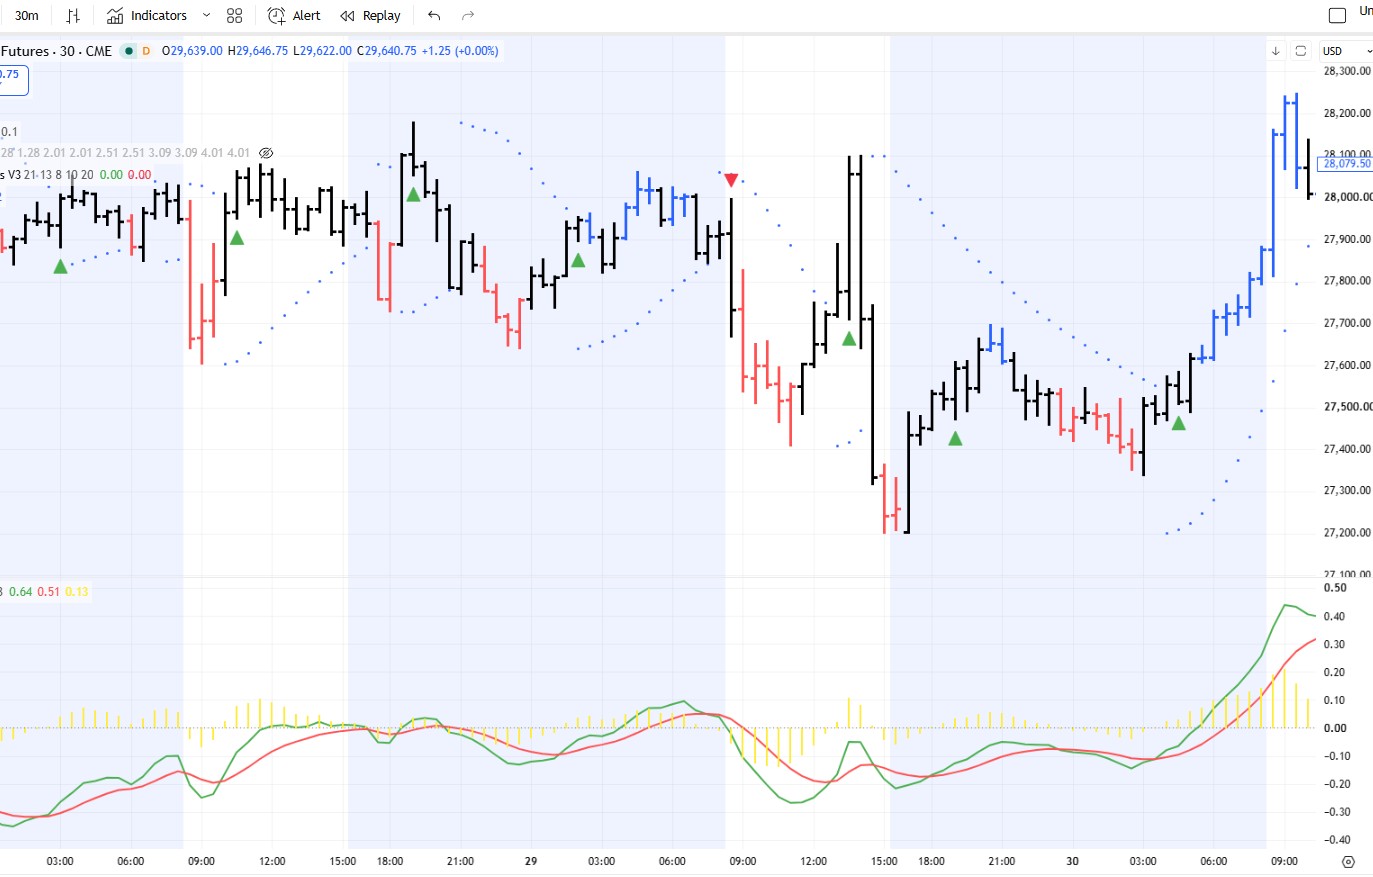
ILM: ILM produces arrows on the charts that signal potential change in direction/ momentum. The ILM is based on moving average, volatility system and momentum.
F50: The F50 tries to measure institutional activity that may lead to continued momentum within larger time frame. It looks for correlation with volatility systems and attempts to sense possible continuation of immediate trend.